Create Real Estate Heat Map
This project will assist in wrapping my head around the real estate prices near me and also proof of concept for creating high-utility maps.
This project uses a .txt file with html stored in it, I did it this way to avoid using a robot to collect price data. From the HTML the script finds address, sqft, and price info.
The script then uses geopy.geocoders Nominatim to get coordinates for the addresses. I had to remove the city name to make the addresses more generic otherwise I get a few NoneTypes for addresses that couldn't be resolved.
   address = address_elements[i].text
   address = address.replace("Manor, TX", ",")
   address = address.replace("Austin, TX", ",")
   location = geolocator.geocode(address)
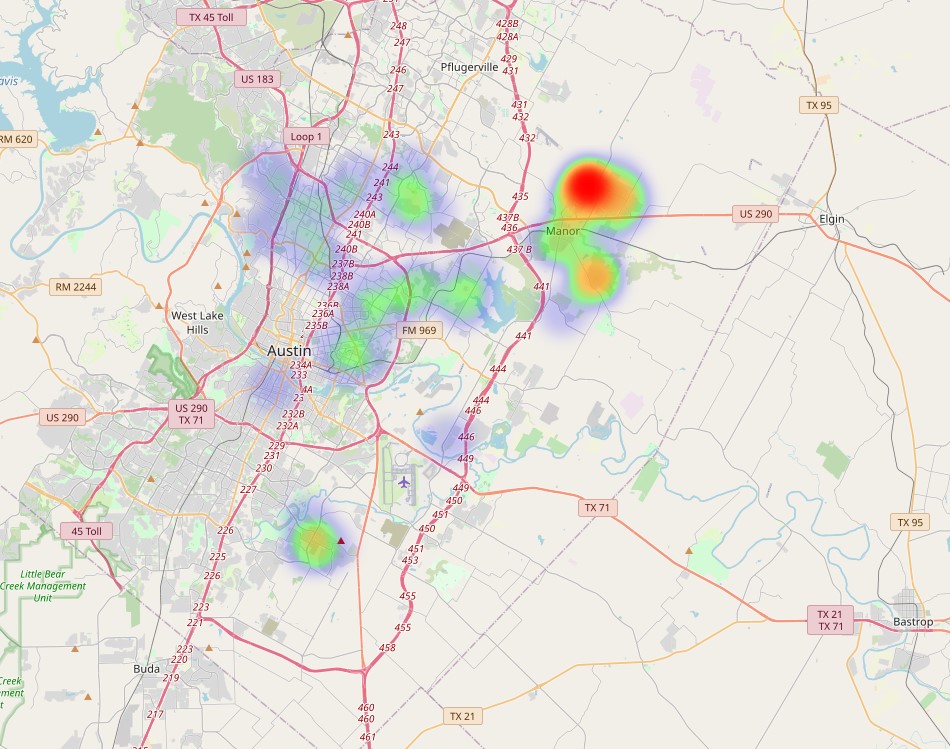
This stores the address, sqft, price, and coordinates into a text file. The file is used in the next function to generate the visual.
I used this code to generate the heatmap
   plugins.HeatMap(data, name='Price Heatmap',
   overlay=True, control=False,
   show=True,min_opacity=0.2,
   min_val=min(data, key=lambda x: x[2])[2],
   gradient={0.2: 'blue', 0.4: 'lime', 0.6: 'orange', 1: 'red'}
   ).add_to(m)

   m.save("heatmap2.html")
Python makes it possible to synergize a lot of features into a few lines of code. There is a lot more I can work into this project. I'm looking to make the heat map where to help visualize price alone rather than for-sale-density and price. This will be tricky since the house only accounts for an acre or so on the map so getting the right gradient calculation that extrapolates price over areas without data in an insightful way. I also want to work in my subjective $ value of the commute to work, sqft of workshop area (garage/shed), foundation/soil, and efficiency/maintainability. All these rely on my being able to find the data for the property.
Challenge accepted.