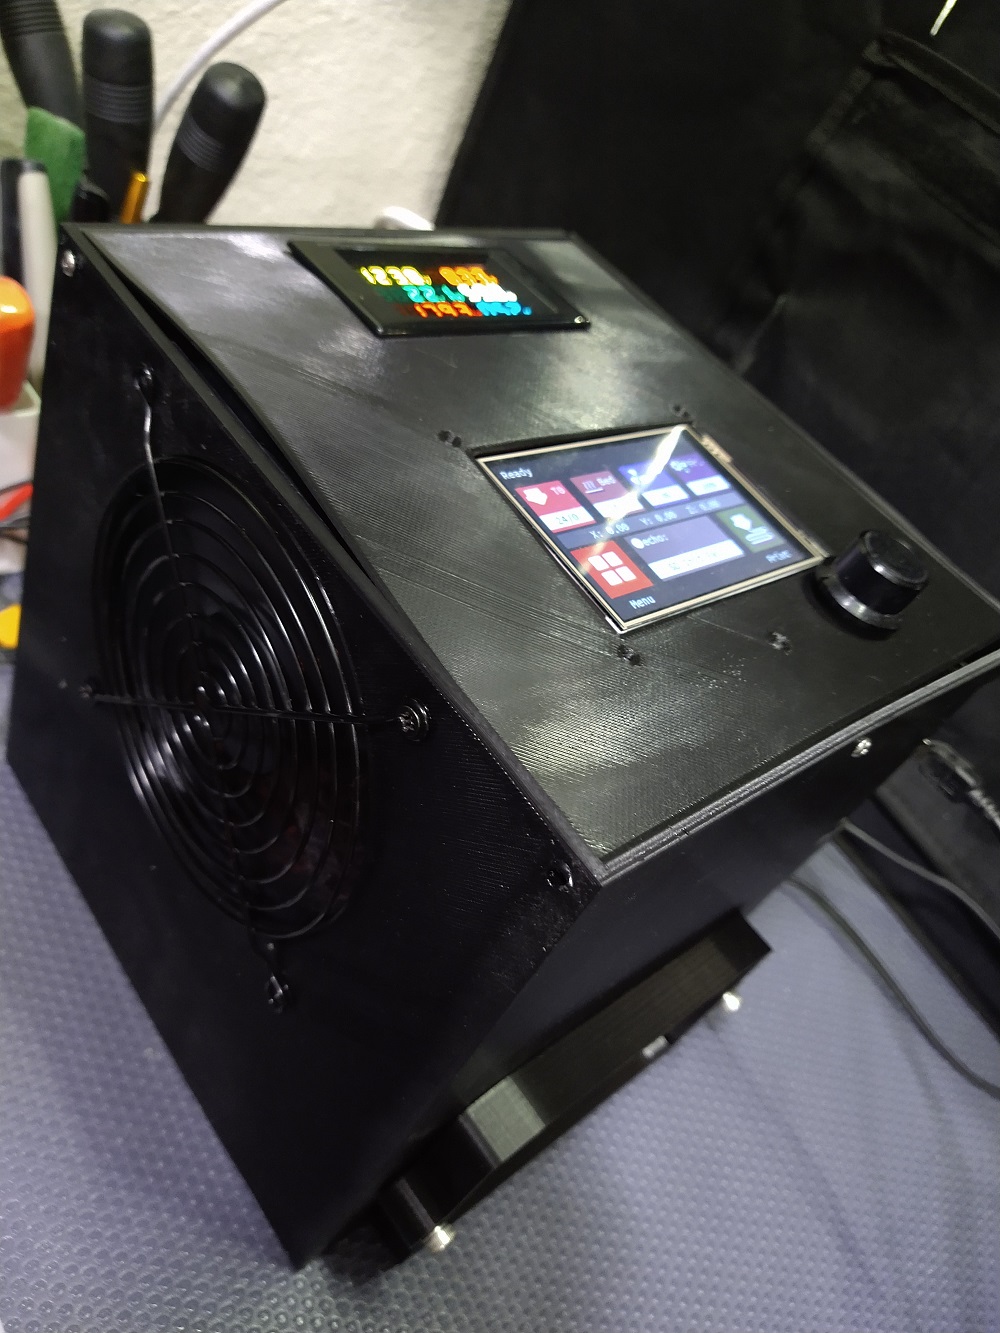
My 3D printer's power supply failed and made the mainboard unstable, started blowing breaker (I think false arc faults from EMI) so both needed to be replaced. Since I was taking the machine apart and making changes I decided to overhaul a few things.

>>View Model<<

Project Punch List:

Essential:

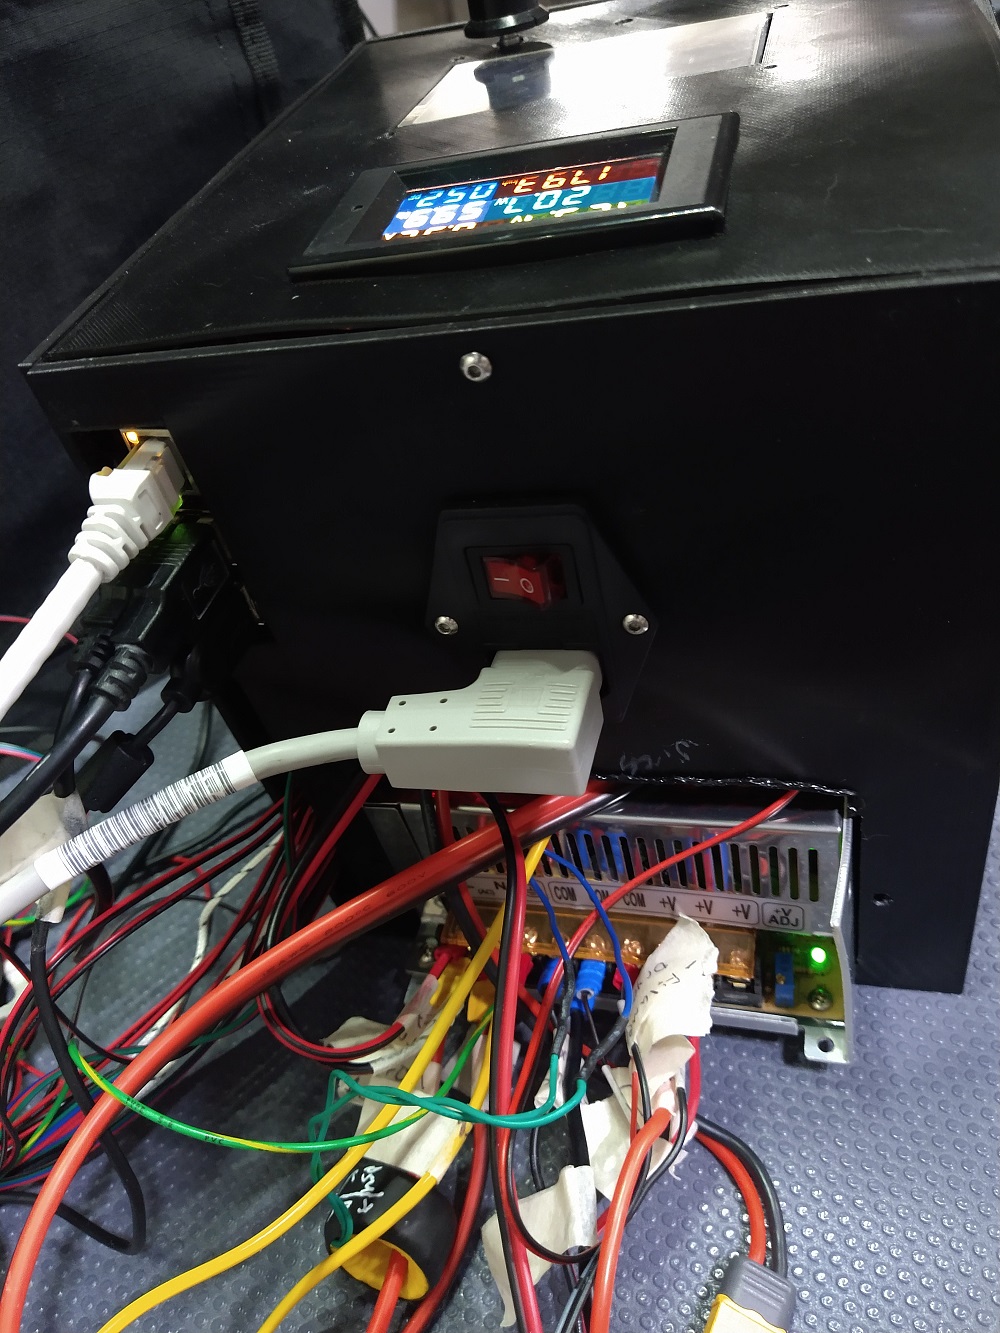
  1. Replaced mainboard and power supply
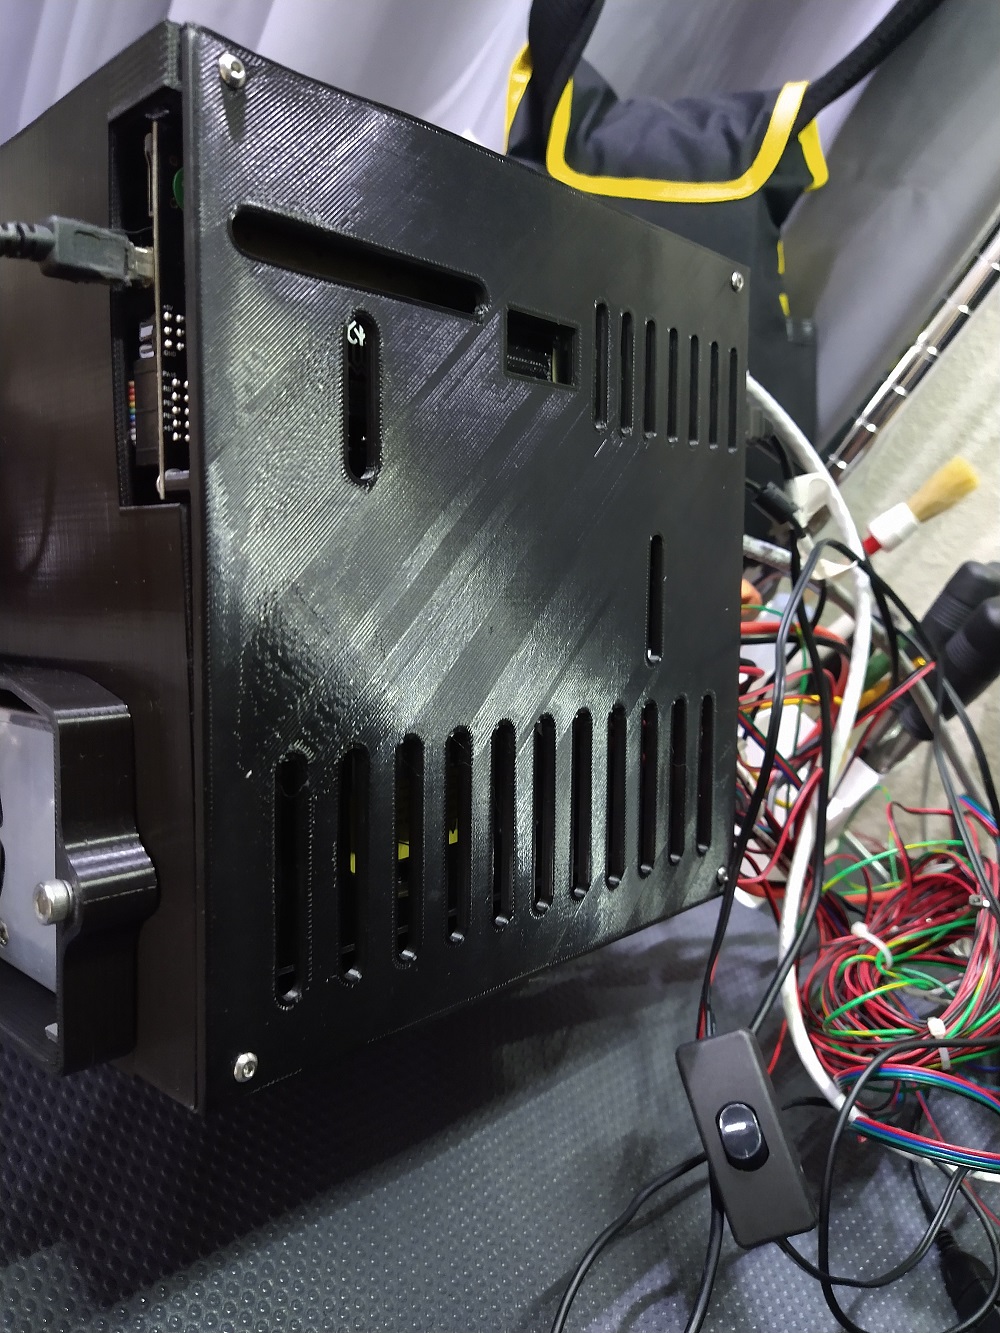
  2. Modelled a bigger chassis for new components and power supply
  3. Grounded main frame, X axis & gantry, and heatbed
  4. Replaced poorly designed dual extruder - the steel teeth dug into the aluminum frame(looked like it could fail soon)

Upgrades:

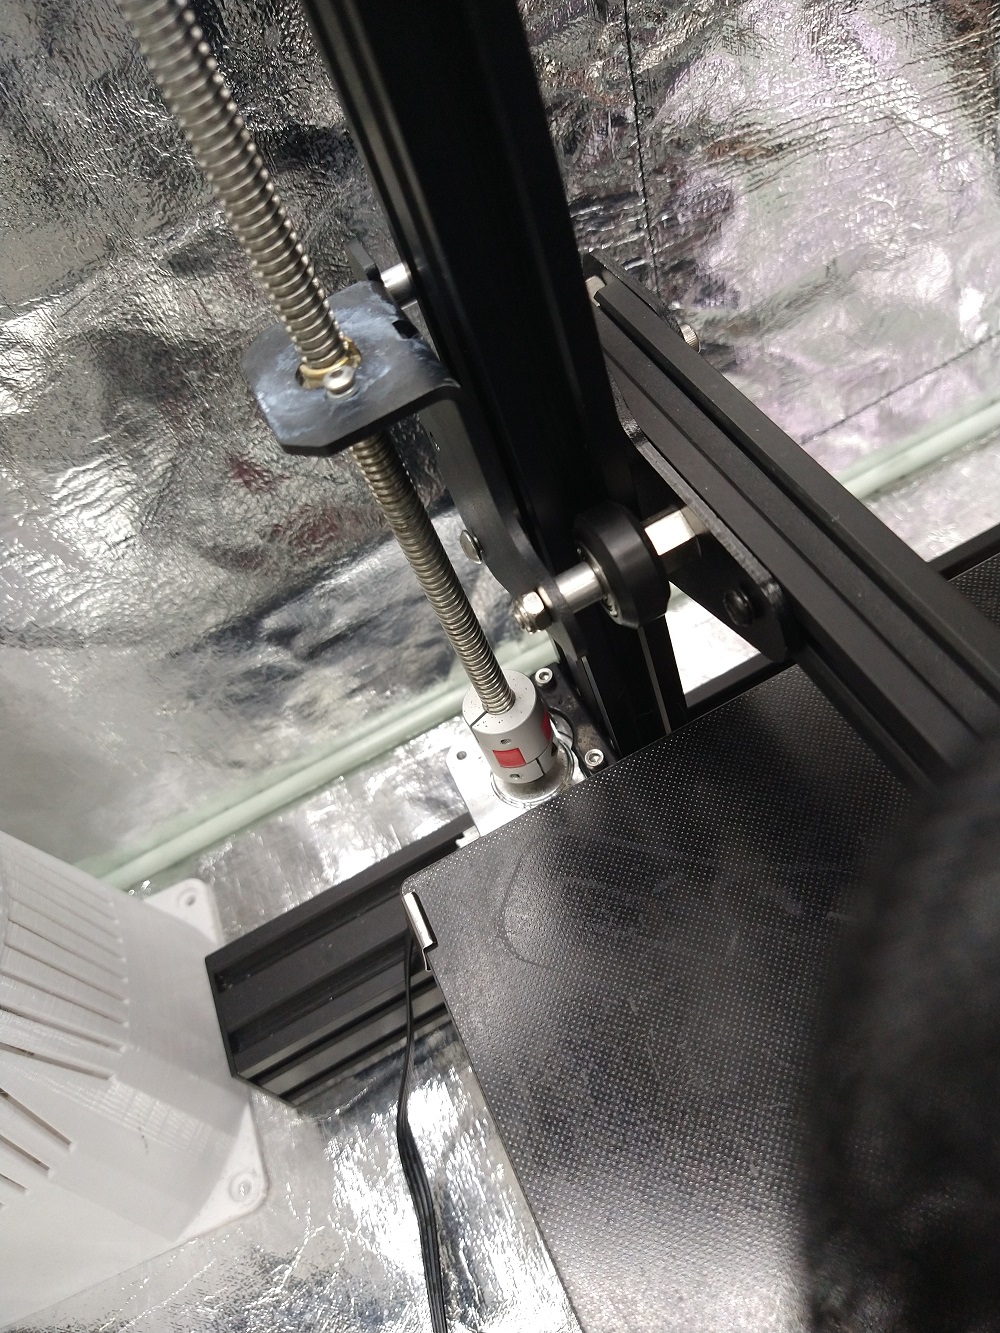
  1. Installed Dual Z axis and switched to 2mm pitch threaded rods
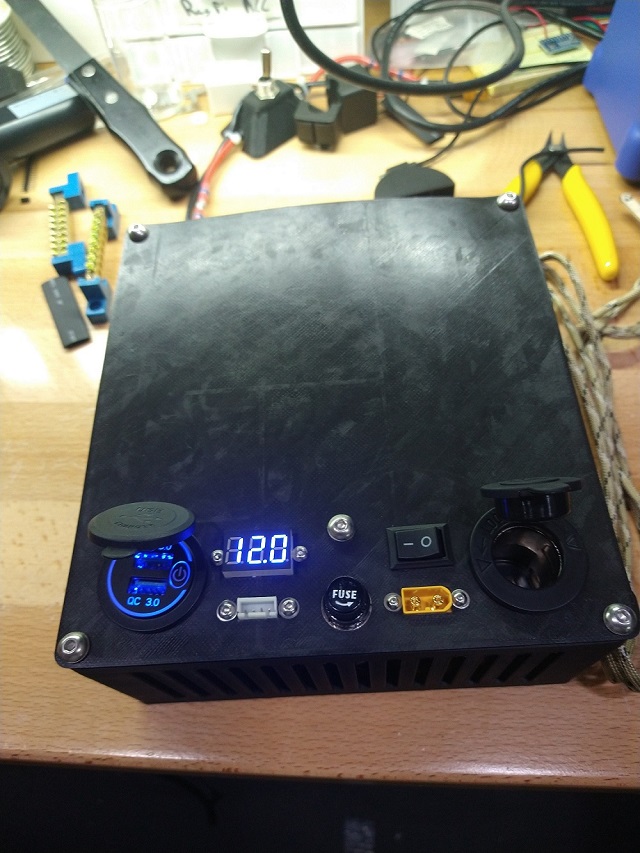
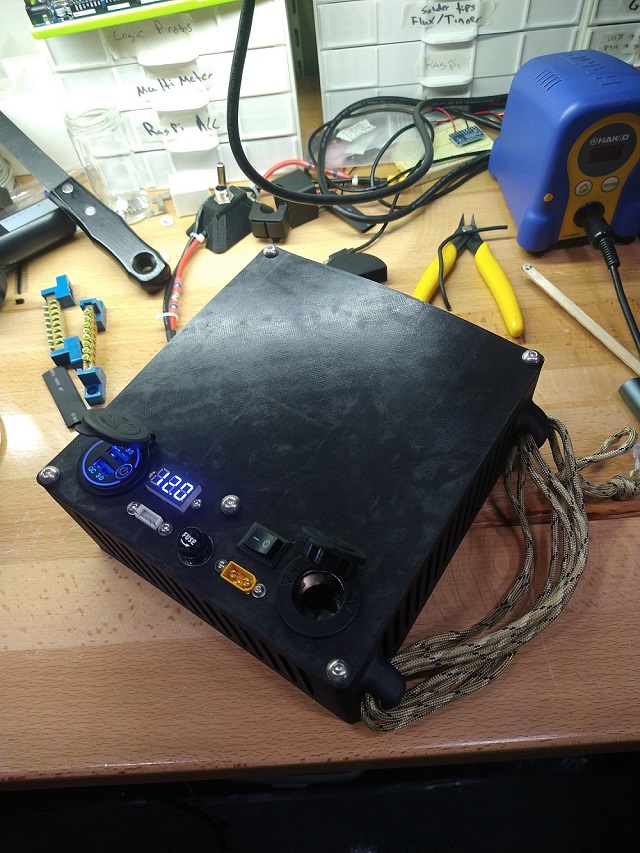
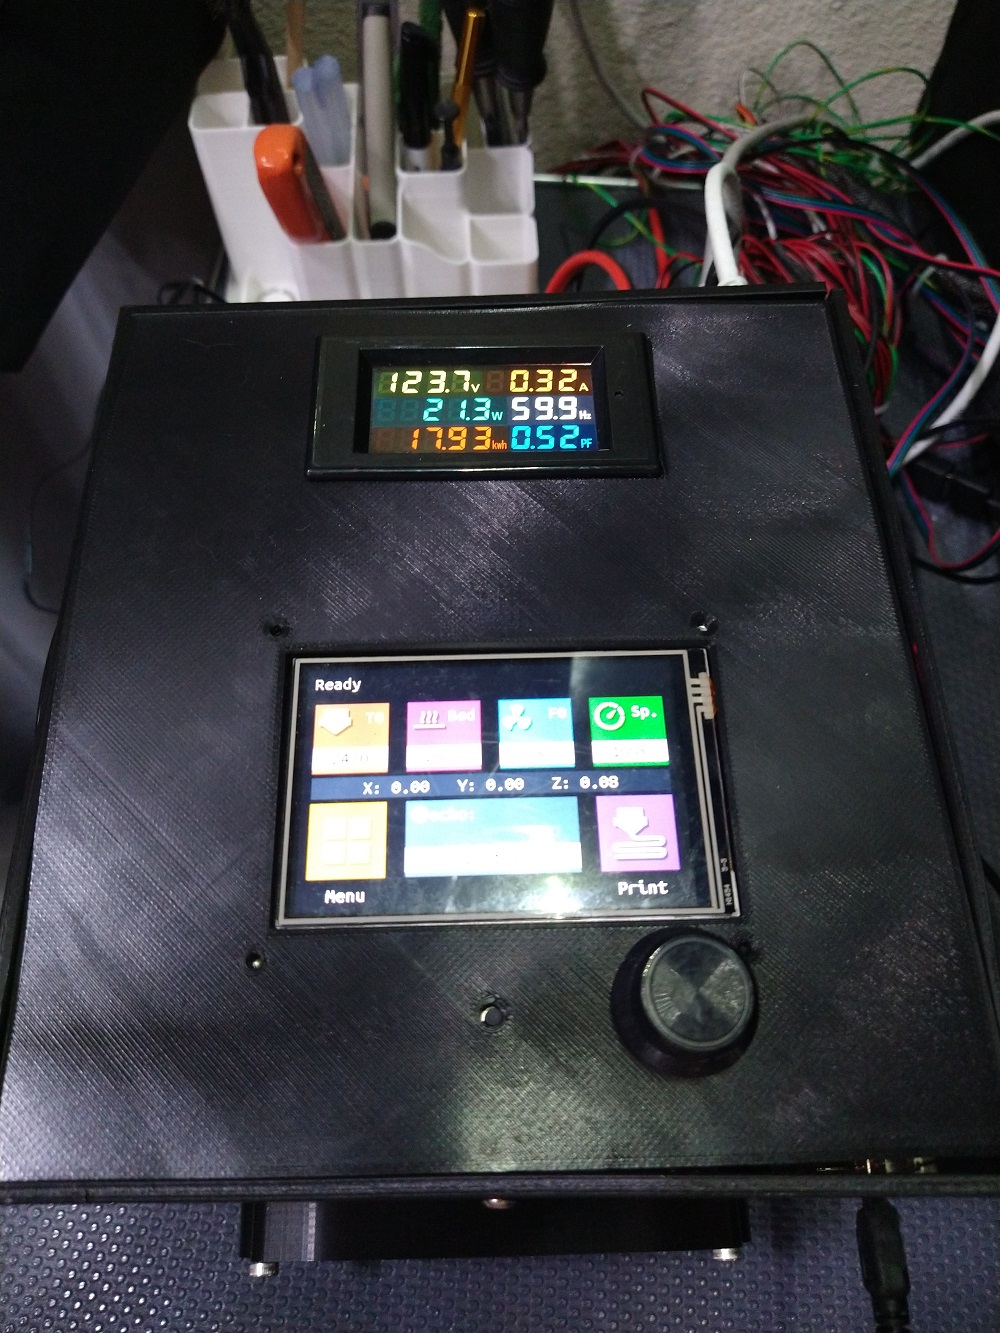
  2. Installed power metering module - measures voltage/frequency/current/wattage and total kWh
  3. Installed new all metal hotend that allows >300C rated thermocouple so eventually printing carbon fiber nylon and other high temp filaments
  4. Installed higher wattage hotend heating cartridge
  5. Installed 24 volt cable to supply power to filament dryer

Bottlenecks:

Some problems came up with dual Z axis and thread pitch change.

  1. Adjusting for the new thread pitch was easy - just increased the steps to 1600steps/mm and print and measure calibration cube then adjusted based on findings
  2. Had issues with binding/grinding/squealing from the threaded rods binding up in their mounts which was resolved with the following (order of importance)
    1. Increased the Z motor amperage from the default to ~1 amp - this was the first thing I figured which restored my hope in the project. This increased binding but fixed the issue with only one Z stepper turning and the other partially
    2. Loosened the bolts holding threaded nut to the X axis which allowed the threaded rod some up/down play on the y axis. Largely eliminated binding
    3. Lots of dry lube. Decreased squealing
    4. Installed flexible shaft couplings to the rods. Decreased the chance of binding
When replacing the heating cartridge with a higher wattage I ran PID tuning then reconfigured with those results.

The modeling took about 6 hours to do but I procrastinated. Once I moved from having a 2D sketch to having a 3D outline of the bottom I knocked out the rest of the project of the next couple of weeks - modeling and test printing.

Both the Dual Z and the slower pitch threaded rod greatly improved my tall prints. I think this is mostly because of the increased Z precision from the 1600 steps per mm from the 400 I had previously.

This is a random project “How to animate a heat map with date slider bar”

Lots of issues cropped up. Mostly from getting out of the swing of how to use pandas and different data structures/amending them when certain conditions are met.

This will be more useful once labels are added to the coordinates. I've worked in labels but it slows down Jupyter a lot and needs more work.

>>>Heat Map<<<
from this CSV file

import folium
import folium.plugins as plugins
import numpy as np

from datetime import datetime, timedelta
import pandas as pd

# Read the data from the CSV file
df = pd.read_csv('data.csv')

# Convert the date columns to the appropriate data type
df['start_date'] = pd.to_datetime(df['start_date'])
df['end_date'] = pd.to_datetime(df['end_date'])

# Initialize a dictionary to store the data
data_dict = {}

# Iterate over each row in the DataFrame
for index, row in df.iterrows():
    start_date = row['start_date']
    end_date = row['end_date']
    latitude = row['latitude']
    longitude = row['longitude']

    # Generate a list of dates between the start and end date
    dates = pd.date_range(start=start_date, end=end_date, freq='D')

    # Create a row for each date and append it to the data dictionary
    for date in dates:
        date_str = date.date().isoformat()
        coordinates = [latitude, longitude]
        if date_str in data_dict:
            data_dict[date_str].append(coordinates)
        else:
            data_dict[date_str] = [coordinates]

# Convert the data dictionary to a list of lists
data = [[date, coordinates] for date, coordinates in data_dict.items()]

# Create a new DataFrame from the data list
new_df = pd.DataFrame(data, columns=['date', 'coordinates'])

date_list = new_df['date'].values.tolist()
coordinate_list = new_df['coordinates'].values.tolist()

# Save the DataFrame to a CSV file
new_df.to_csv('output.csv', index=False)

map_data = coordinate_list
time_index = date_list

m = folium.Map(location=[center_lat, center_lon], zoom_start=10)
hm = plugins.HeatMapWithTime(map_data, index=time_index, auto_play=True, max_opacity=.5, radius=30)
hm.add_to(m)
m.save('heatmap.html')
m

I am cleaning out my fridge :) and have had these 18650s in there for a while so I am using them to create a 12 volt power supply.

This is a battery I will be using for a cellular signal amplifier and also used to charge my cell phone, laptop, and Lipos while out in the field - middle of nowhere. It is built from leftover 18650s from a 3.0 kWh build I did a few years ago so these have just been sitting in my fridge. Each averages ~1800 mAh so I should be able to produce 420 Wh from a full charge. I plan on charging with a 100 watt solar panel while out in the field.

Long story short:
The positive from the protection board goes to the fuse then through the switch then to the positive ends of 12v socket, quick charge socket, the voltmeter, and the xt60 - all soldered together and head shrink wrapped.

The negative side goes from the projection board to the negative ends of 12v socket, quick charge socket, the voltmeter, and the xt60. So the same with the positive but the fuse and switch aren't involved.

The material links can be found on the Thingiverse/YouTube links below.

The STLs for the project https://www.thingiverse.com/thing:6003895

This project will assist in wrapping my head around the real estate prices near me and also proof of concept for creating high-utility maps.

This project uses a .txt file with html stored in it, I did it this way to avoid using a robot to collect price data. From the HTML the script finds address, sqft, and price info.

The script then uses geopy.geocoders Nominatim to get coordinates for the addresses. I had to remove the city name to make the addresses more generic otherwise I get a few NoneTypes for addresses that couldn't be resolved.

   address = address_elements[i].text
   address = address.replace("Manor, TX", ",")
   address = address.replace("Austin, TX", ",")
   location = geolocator.geocode(address)

This stores the address, sqft, price, and coordinates into a text file. The file is used in the next function to generate the visual.

I used this code to generate the heatmap

   plugins.HeatMap(data, name='Price Heatmap',
   overlay=True, control=False,
   show=True,min_opacity=0.2,
   min_val=min(data, key=lambda x: x[2])[2],
   gradient={0.2: 'blue', 0.4: 'lime', 0.6: 'orange', 1: 'red'}
   ).add_to(m)
   
   m.save("heatmap2.html")

Python makes it possible to synergize a lot of features into a few lines of code. There is a lot more I can work into this project. I'm looking to make the heat map where to help visualize price alone rather than for-sale-density and price. This will be tricky since the house only accounts for an acre or so on the map so getting the right gradient calculation that extrapolates price over areas without data in an insightful way. I also want to work in my subjective $ value of the commute to work, sqft of workshop area (garage/shed), foundation/soil, and efficiency/maintainability. All these rely on my being able to find the data for the property.

Challenge accepted.

A few of my projects have been held back because the cost of a chassis would double the project cost and there aren't dependable/customizable solutions for small and quick electronics projects that need a case. I've used FDM printing to get roughly what I need but the time modeling spans hours and I don't feel like I'm using Fusion 360 to its full potential.

I decided to take CAD and Digital Manufacturing on Coursera. The specialization deals with building a drone frame for Nylon printing.

The STLs for the project https://www.thingiverse.com/thing:5810830

Issues that cropped up during this project:

  1. The course looks to be from around 2018. FPV quadcopters have come a long way so sourcing parts was difficult for a novice. I ended up with parts with poor documentation
  2. The model is too large for a typical 3d printer to print so it had to be broken into several parts (see Fusion snip below)
  3. Nylon is not a very good material for drone frames. It flexes a lot and is heavy relative to strength. The frame flexing also makes it more difficult for the flight controller to assign thrust
  4. The component tray model could not fit two 4S LiPos so it was redesigned

It ended up flying. I think a voltage drop ended up crashing the flight controller making it unresponsive to remote control and the drone started drifting to the unknown. Luckily it hit a power line and I was able to recover it.

Inspiration for this project was Makezine article and blog post "Fresh Air" and Adafruit's SCD-30 sensor page.

A lot of interest in indoor CO2 monitoring was sparked by a professor that built a CO2 monitor for his classroom. He found that the CO2 levels at the end of class were enough to make you groggy/sleepy and therefore not able to learn as well.

In my experimentation, an interesting discovery was the elevation of CO2 levels in a short drive with the windows up. My car, a Nissan Sentra, approached 2000 ppm in a one-person 30-minute commute. Having one window down @55 mph (90 kph) for a minute brought the levels back to below 1000 ppm.

This project was from the beginning of 2021. It took around 40 hours over a few months. It can store around 3 kWhs and has a max output of 2500 watts peak/1500 watts continuous. It can run a campsite and be charged off of a laptop charger or solar panels/wind generator – anything that produces between 12 and 48 volts of power.

Most of the project is based on LithiumSolar's video.

Recycled 2200 mAh modem cells were sourced from batteryhookup.com. I've sourced some 2600 mAh cells but not the 364 required for this project. The total storage of the generator ended up being a little less than 3.0 kWh after testing all cells.

A kWeld was used for spot welding. 4P nickel strip was sourced to simplify connections for each parallel group.

0%